

Learn about trends in the landscaping services industry and find more information on starting a landscaping services business. Don’t forget you can receive free or low-cost training and free professional business advice, from your local Small Business Development Center!
View our related business report here: Cleaning Services Business
Get a free Landscaping Services business plan template on our Business Plans page.
Landscaping Services COVID-19 Resources
In response to the global COVID-19 pandemic, shelter-in-place orders and physical distancing measures have affected many businesses. Here is a look at the impact to the landscaping industry. Landscape services are considered essential services in most of the U.S., but COVID-19 is still impacting the landscape industry in many ways. A survey conducted in April by Green Industry Pros reveals that more than 50% of landscaping businesses have experienced an impact to their revenue. Due to stay at home orders, people are spending more time in their yards as noted by the 60% reported cancellations in the residential market. Here are additional COVID-19 business resources specific to this industry:
- SBDCNet’s COVID-19 Small Business Resources
- SBDCNet’s COVID-19 Industry Resources
- Coronavirus Resources Center – National Association of Landscape Professionals
- Coronavirus Resources – Lawn & Landscape
- Landscape Management – How companies are handling COVID-19 concerns
Landscaping Services Business Overview & Trends
NAICS Code: 561730, SIC Code: 0782
This landscaping services industry summary is from First Research which also sells a full version of this report.
- “Companies in this industry provide landscape care and maintenance services for both commercial and residential customers. Major US companies include Asplundh Tree Expert, BrightView Landscapes, The Davey Tree Expert Company, and TruGreen. Outside the US, major companies include Active Tree Services (Australia) and Idverde (France). As the world becomes more urban, interest in green spaces — including trees, lawns, flowers and hedges — is increasing in cities around the globe, driving demand for landscaping services. Global demand is driven mainly by factors such as housing starts, employment, and consumer spending. The US landscaping services industry includes more than 100,000 establishments (single-location companies and units of multi-location companies) with combined annual revenue of about $82 billion.
- Competitive Landscape: Demand is driven partly by construction spending and partly by the economy’s overall health. Because management and equipment costs are mainly fixed, the profitability of individual companies depends on demand volume and operations’ efficiency. Small companies can easily compete with big ones, except in providing services to large customers. Big companies operate mainly through local branches or offices that have operations almost identical to those of local companies. The US industry is highly fragmented: the top 50 companies generate about 15% of revenue.
- Products, Operations & Technology: Landscaping services include commercial and residential landscape maintenance, landscape construction, irrigation systems, tree services, chemical lawn care and pest control, and “line-clearing,” or branch removal around utility lines. ”
Additional resources on the landscaping industry and trends include:
- Lawn & Landscape – 2019 State of the Industry Report
- National Association of Landscape Professionals – Landscape Industry Statistics
Landscaping Services Business Customer Demographics
Major customer segments for landscaping services are reported by IBISWorld, which offers full version of the report for purchase.
- Landscaping businesses provide services to residential, commercial, and public sector clients.
- Residential clients provide the highest industry revenue at 48.3%. The segment include single- and multi-family homes. Demand from homeowners is dependent on their disposable income for this service. The segment would also include home builders and homeowners association (HOA), the latter providing the service to ensure compliance with HOA standards.
- Commercial clients, at 42.5%, account for the next largest segment driving industry revenue. The category includes clients such as hotels, retail centers and other office space. For customers in this segment, services are provided to building exteriors as well as to interior green space.
- Public sector clients provide 6.7% of industry revenue. Organizations included in this segment are schools, municipal parks, community centers and other government-owned spaces. Spending from this sector is dependent on annual budgets; however, some services may be included for being deemed essential to the operation of the community.
Additional information on landscaping customers can be found in a variety of trade associations and publications, including:
- Landscaping Business – Understanding the Demographics of your customer
- Landscaping Industry Analysis – Chron
Landscaping Services Business Startup Costs
According to Entrepreneur Magazine, the costs to start a landscaping business are as follow:
- “Startup Costs: Under $2,000
- Home Based: Can be operated from home.
- Part Time: Can be operated part-time.
- Online Operation? No”
Additional landscaping startup costs can be found at:
Lawn Care Services Business Plans
- Residential Lawn Care Services Business Plan
- Lawn & Garden Services Business Plan
- Landscape Contractor Business Plan
- Landscaping Business Plan
Landscaping Services Business Associations
Trade associations often are excellent sources of information on an industry. Here are some relevant landscaping services industry associations:
- National Association of Landscape Professionals
- American Hort
- Ecological Landscape Alliance
- American Society of Landscape Architects
Lawn Care Business Regulations
Although there is no one agency regulating landscaping businesses, the Occupational Safety and Health Administration (OSHA) provides resources for employers in the landscaping industry. The resources covered include professional standards and a guide to identify hazardous chemicals oftentimes used in the industry.
Landscaping Services Publications
Landscaping Services Business Employment Trends
Labors costs are significant expense for a landscaping service. The following are insights from the Bureau of Labor Statistics focused on grounds maintenance workers. A more specific breakdown of wages for Landscaping Services businesses in the US can be found here.
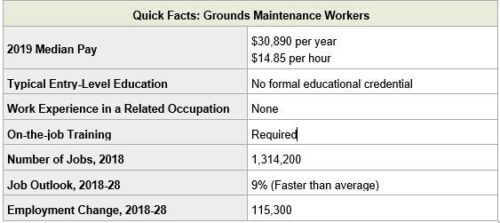
- “Pay: The median hourly wage for grounds maintenance workers was $14.85 in May 2019. The median wage is the wage at which half the workers in an occupation earned more than that amount and half earned less. The lowest 10 percent earned less than $10.53, and the highest 10 percent earned more than $23.18.
- Work Environment: Grounds maintenance workers held about 1.3 million jobs in 2018. Employment in the detailed occupations that make up grounds maintenance workers was distributed as follows:
- Landscaping and groundskeeping workers – 1,205,200
- Tree trimmers and pruners – 55,600
- Pesticide handlers, sprayers, and applicators, vegetation – 35,700
- Grounds maintenance workers, all other – 17,700
Grounds maintenance work is done outdoors in all kinds of weather. The work can be repetitive a physically demanding, requiring frequent bending, lifting, and shoveling.
- Job Outlook: Overall employment of grounds maintenance workers is projected to grow 9 percent from 2018 to 2028, faster than the average for all occupations. Employment growth will vary by specialty. Employment of landscaping and groundskeeping workers—the largest specialty—is projected to grow 9 percent from 2018 to 2028, faster than the average for all occupations. More workers will be needed to keep up with increasing demand for lawn care and landscaping services from aging or busy homeowners and large institutions, such as universities and corporate campuses. The growing popularity of outdoor kitchen and living areas should also increase demand for the services these workers provide. Employment of tree trimmers and pruners is projected to grow 10 percent from 2018 to 2028, faster than the average for all occupations. Many municipalities are planting more trees in urban areas, likely increasing the demand for these workers.”
Additional Small Business Resources
Already in business or thinking about starting your own small business? Check out our various small business resources:
- View more business reports here: Small Business Snapshots
- View small business help topics here: Small Business Information Center
- View industry-specific research here: Market Research Links
- View business plans samples here: Sample Business Plans
Remember, you can also receive free professional business advice and free or low-cost business training from your local Small Business Development Center!
Photo by Samantha Gades on Unsplash